Libertas Releases New Poll
Salt Lake City, UT — It was announced this summer that Salt Lake City would host the 2034 Winter Olympics, but when it comes to the new logo chosen for the games, most voters had a frosty opinion of the look. Just 35% of Utah voters like the controversial new Utah 2034 logo, while 58% dislike it. In one of the rare displays of bipartisanship in the poll, the logo was universally disliked by Republicans (-23%), Democrats (-20%), and Independents (-27%).
![]()
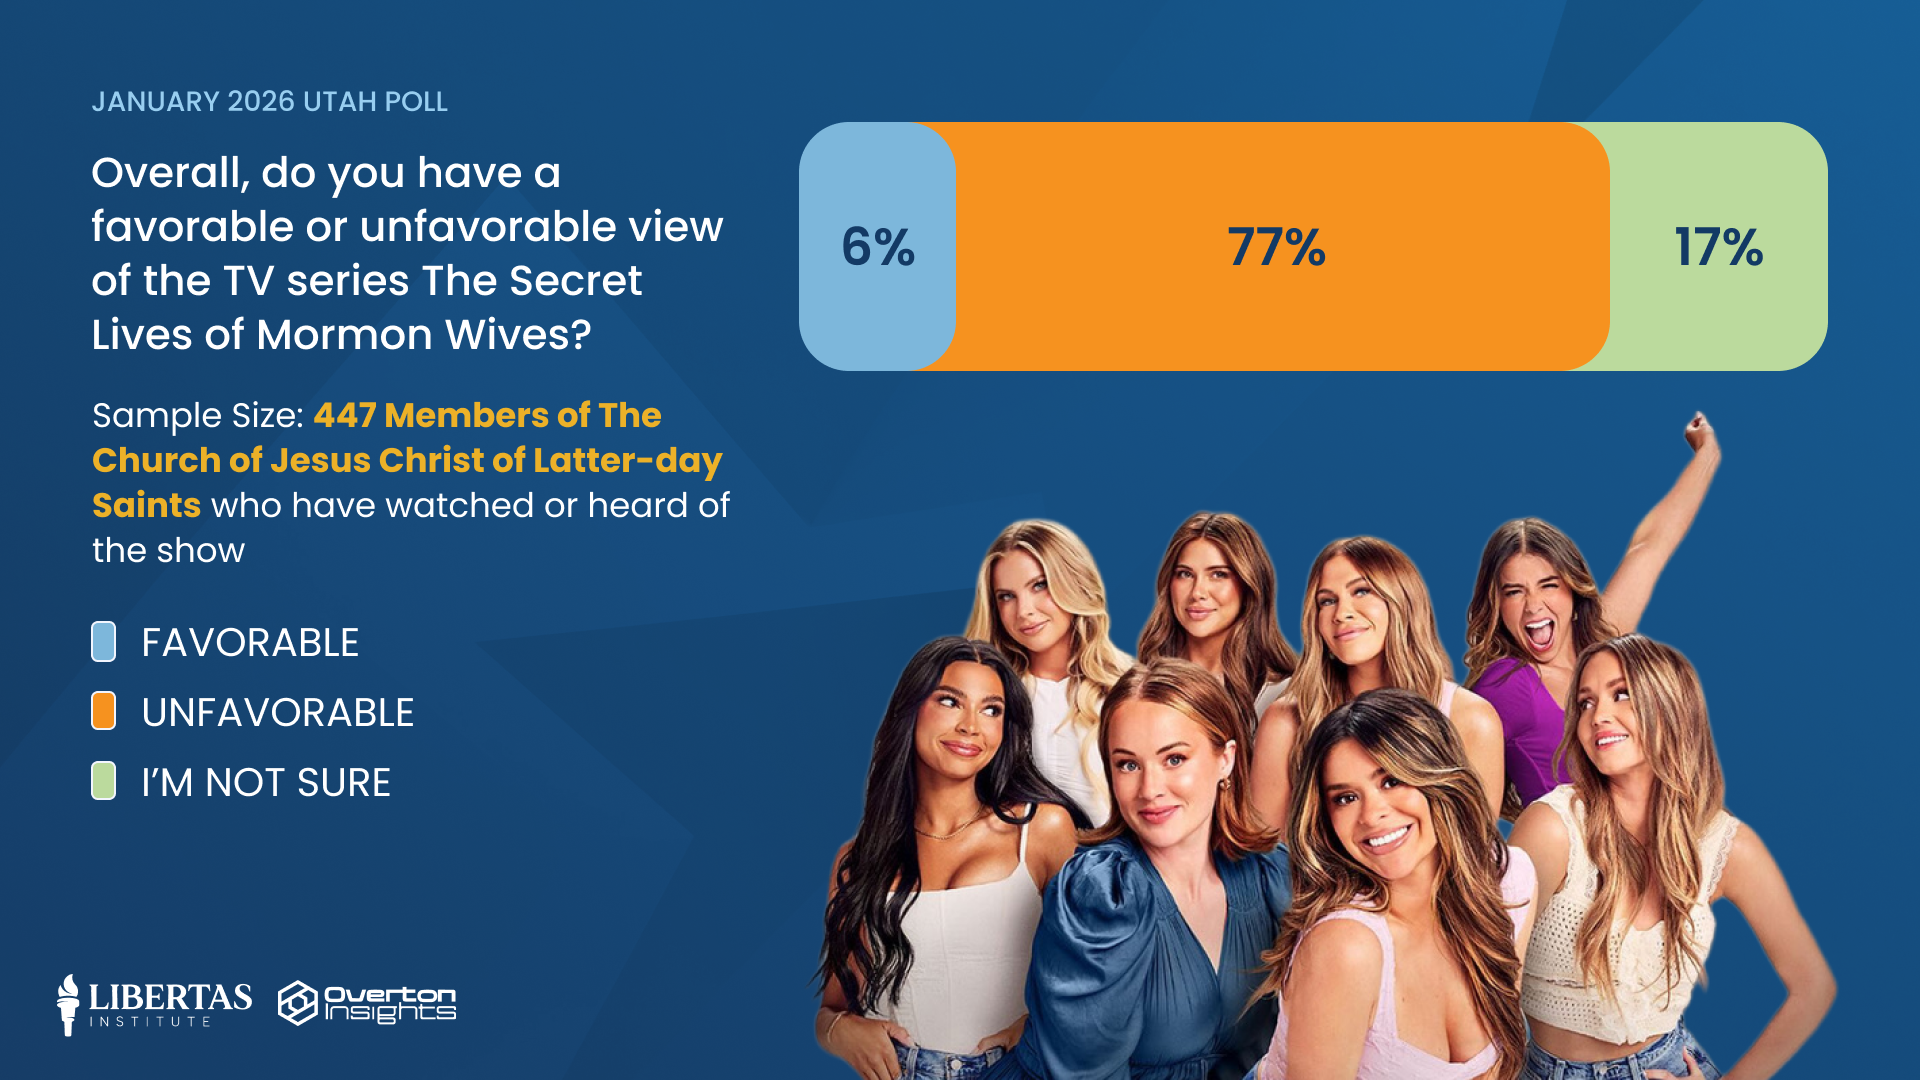
ABC recently released the trailer for Season 4 of its controversial reality show, The Secret Lives of Mormon Wives, set in Utah. Nearly all Utah voters have a negative opinion of the show, with just 14% who have seen or heard of it having a favorable opinion, while 61% have an unfavorable opinion. Despite being underwater with Utah voters (-47%), the show is viewed substantially more unfavorably among members of The Church of Jesus Christ of Latter-day Saints who are familiar with it: just 6% view it favorably, while 77% view it unfavorably.
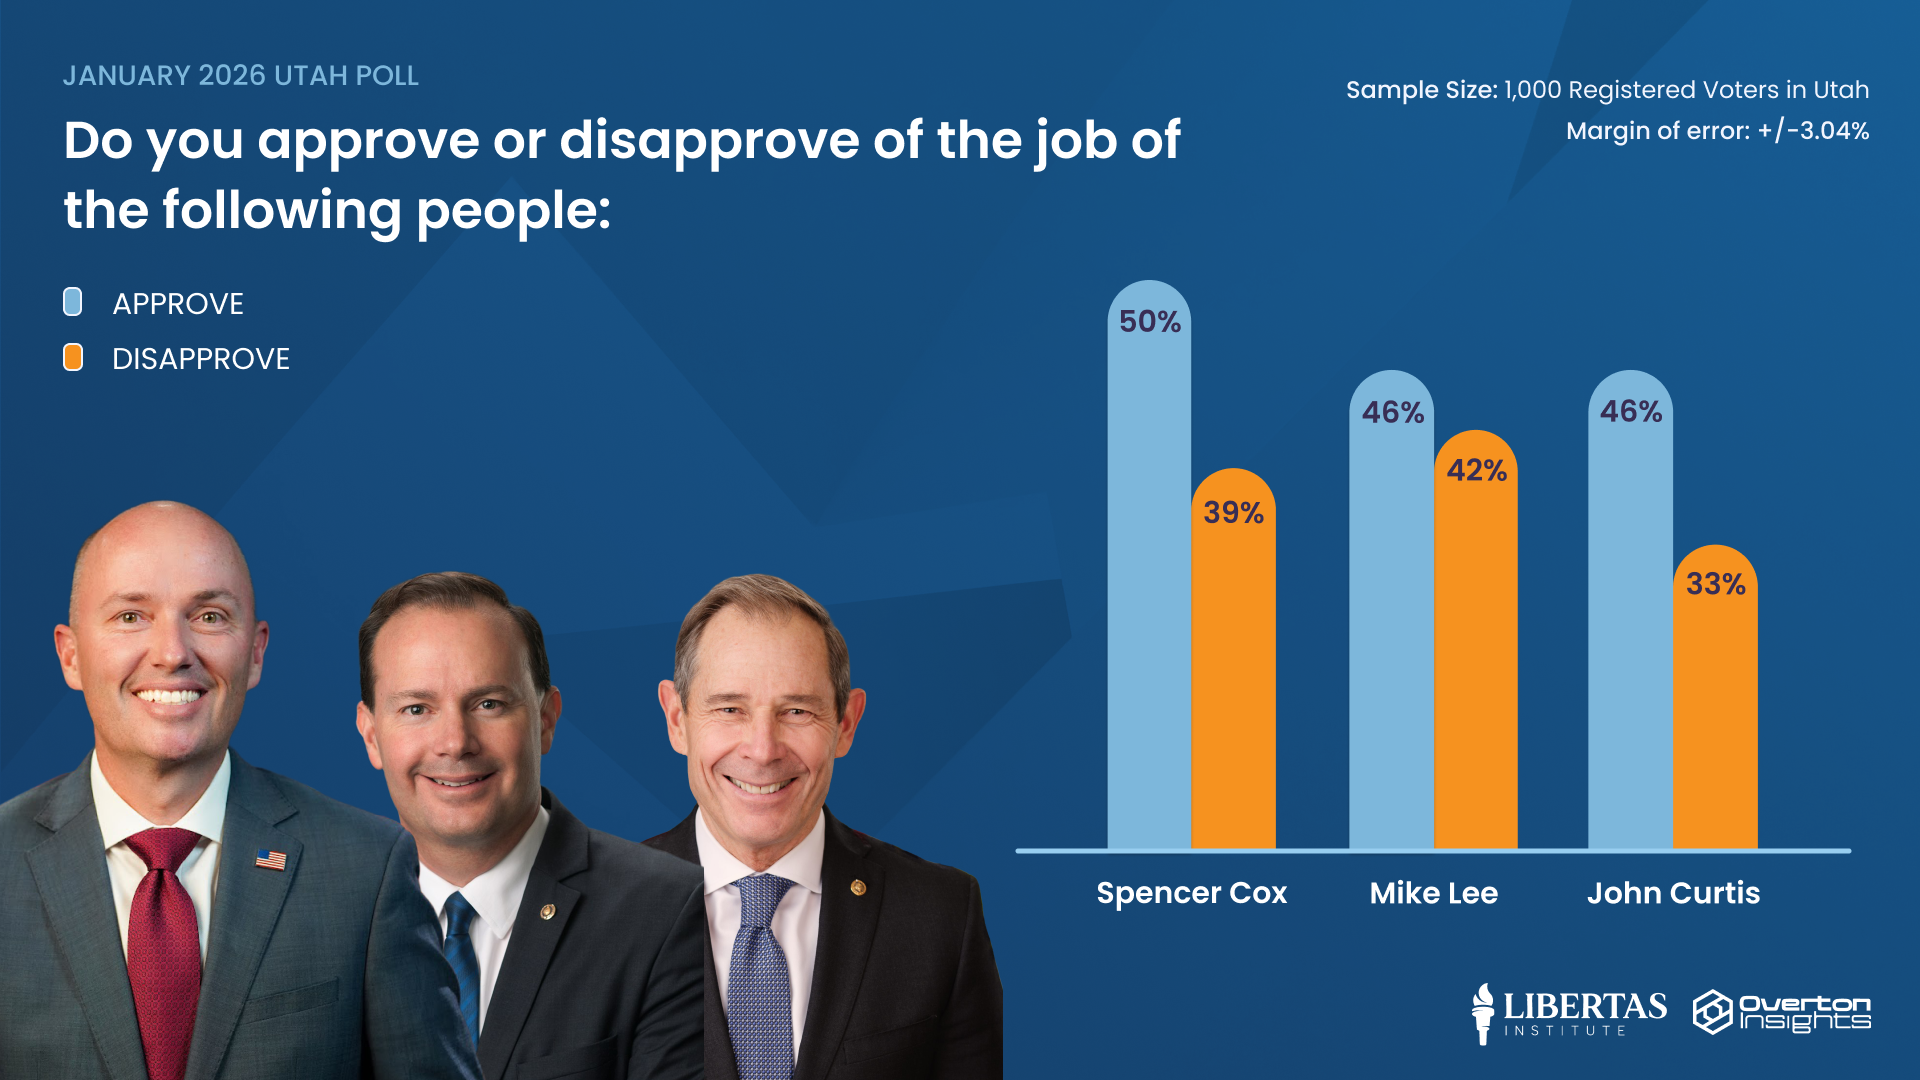
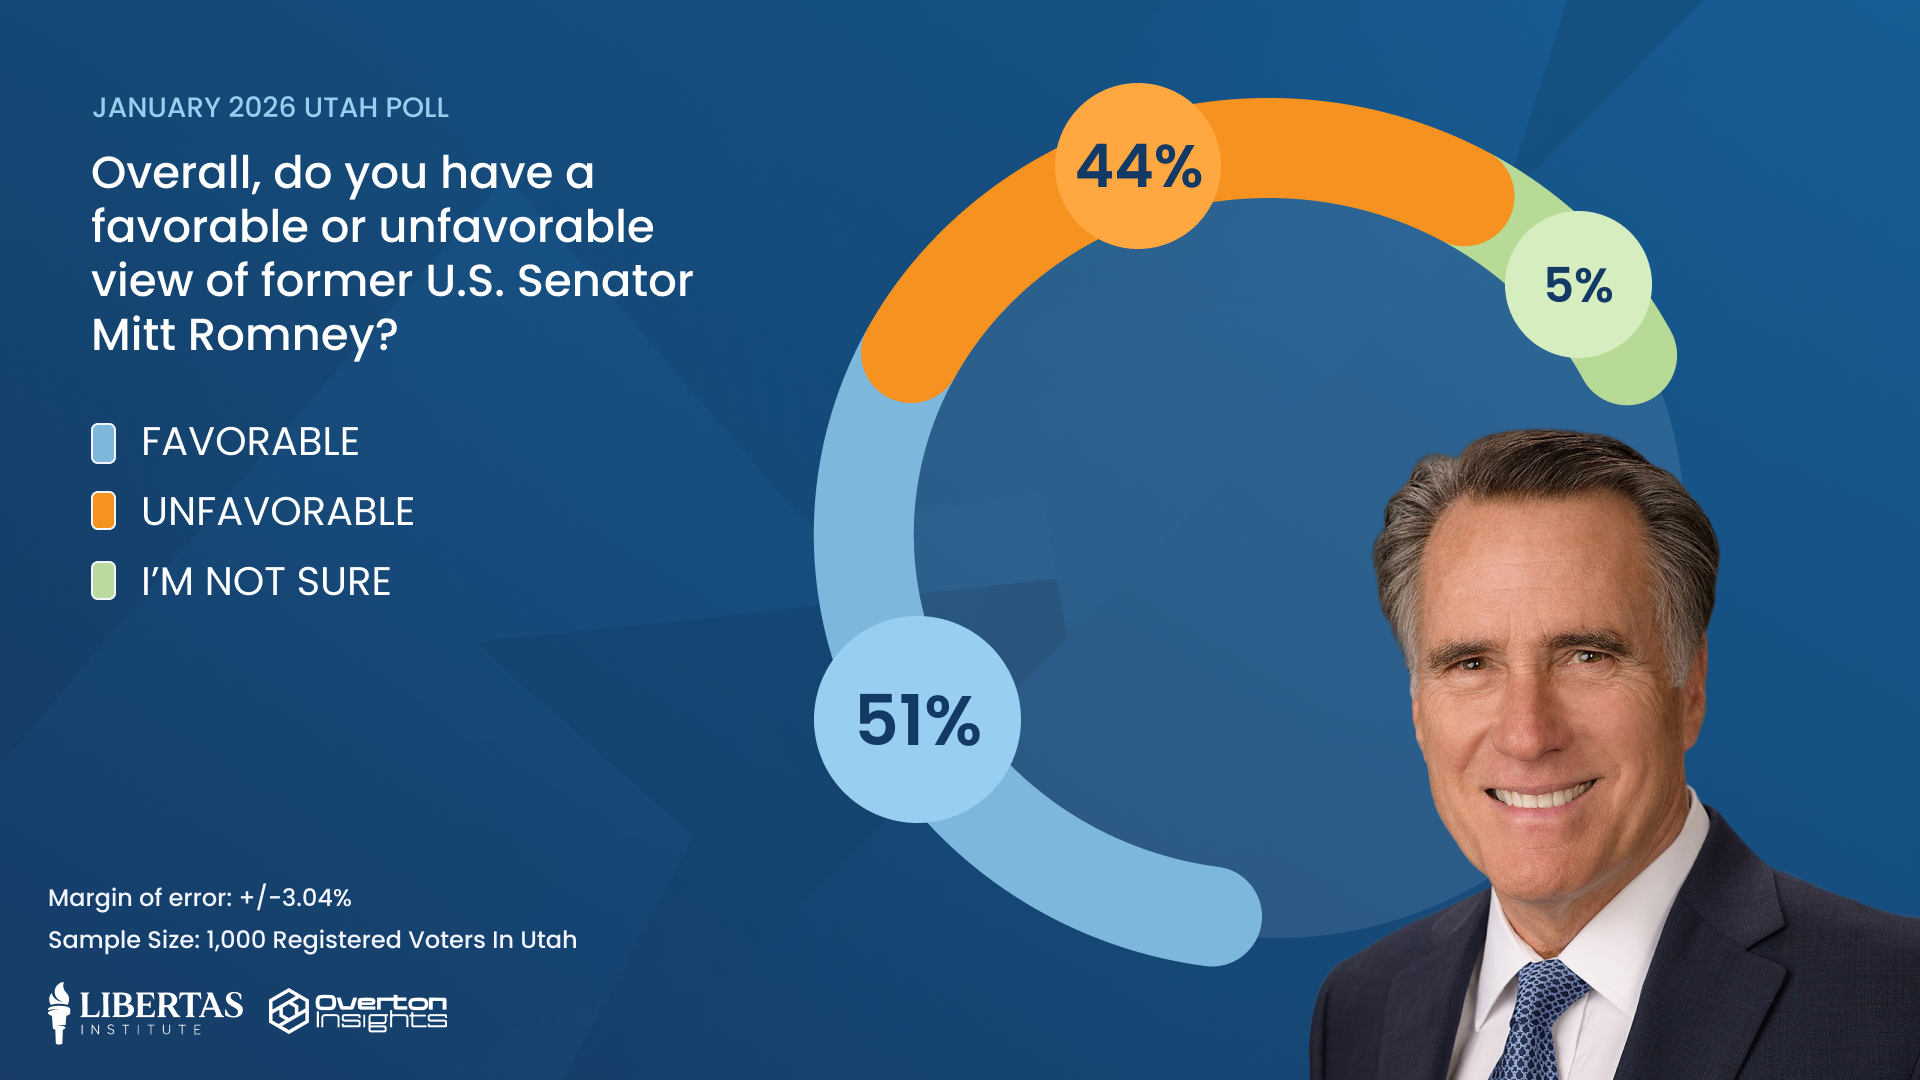
The Libertas Institute/Overton Insights poll also gauged how Utah voters view some current and former statewide officeholders. Senator John Curtis is the most popular politician polled (+13%), followed by Governor Spencer Cox (+11%), former Senator Mitt Romney (+7%), and Senator Mike Lee (+4%).
Interestingly, despite Romney being 7 points above water, the former Republican officeholder actually fared better among Democrats (+12%) than he did among Republicans (-2%).
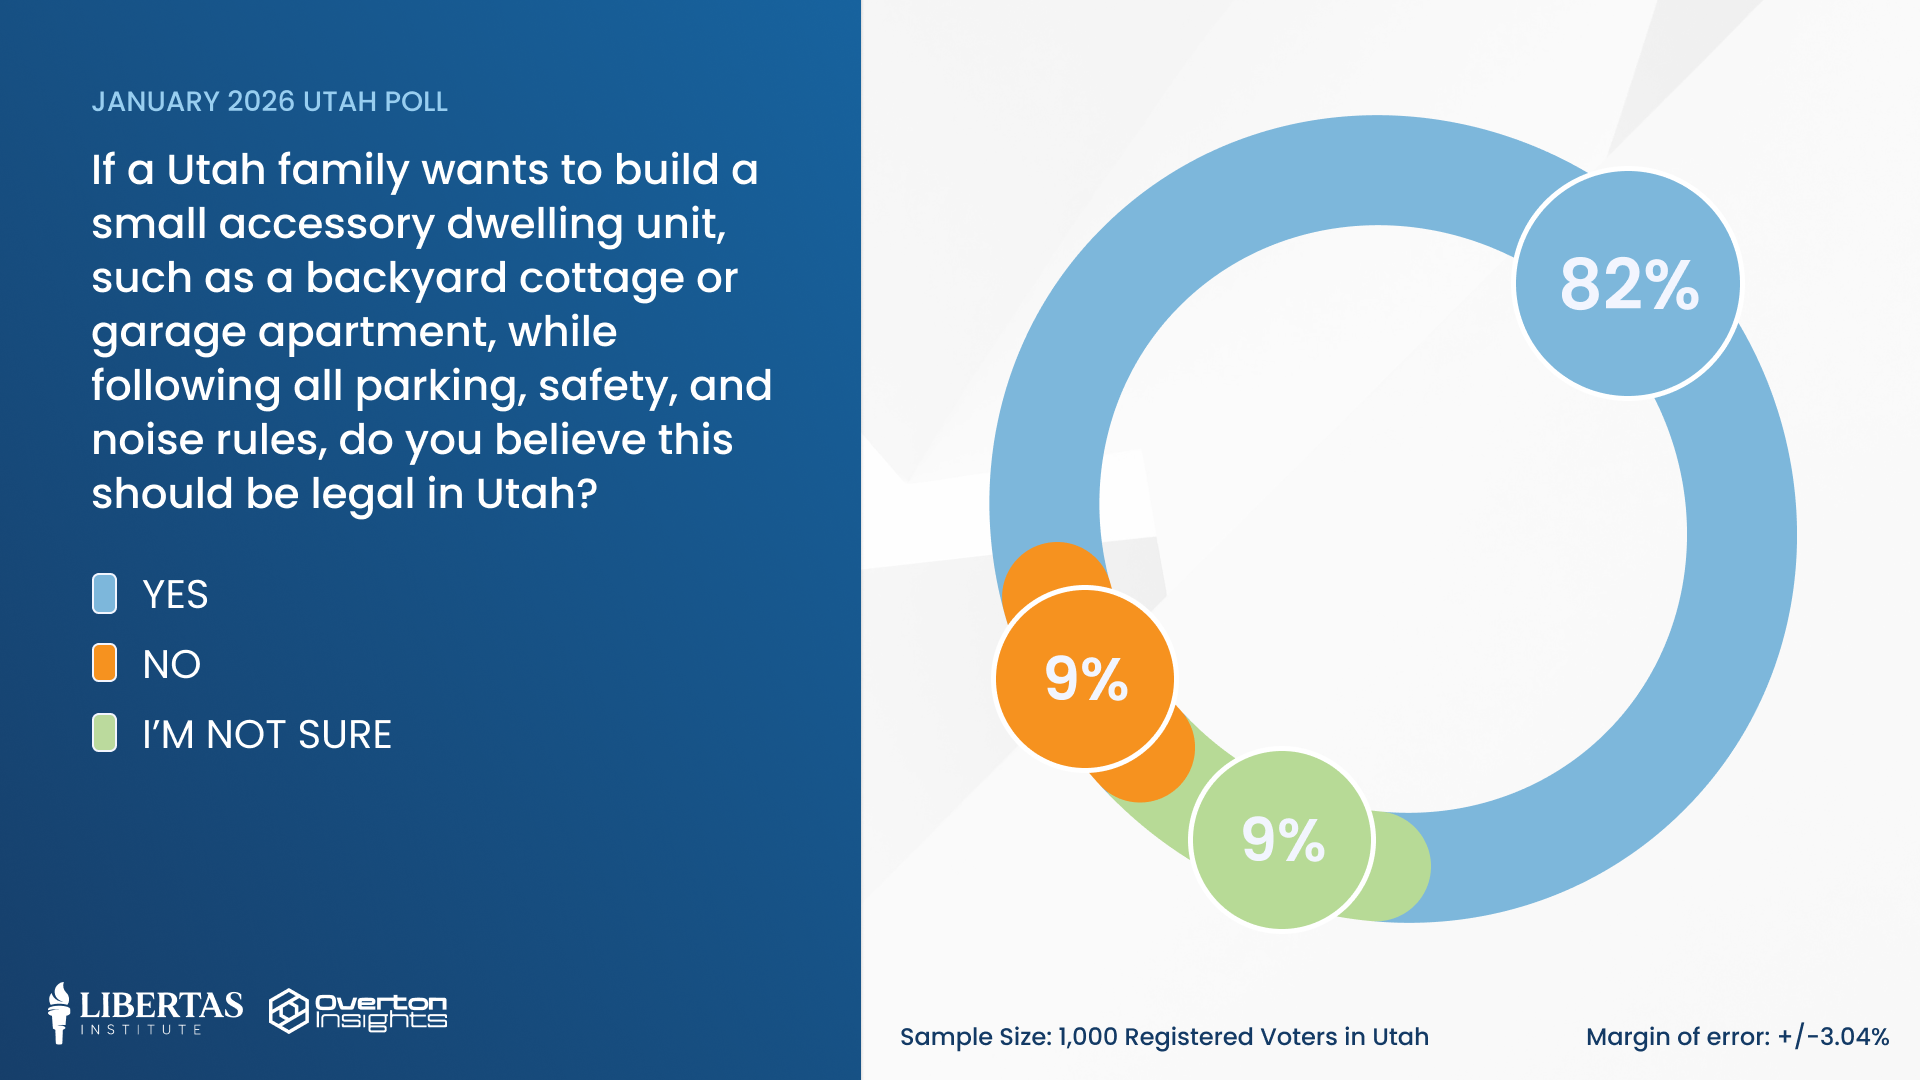
When it comes to the property rights of homeowners, most Utahns believe they should be able to do what they want with their property so long as they follow all parking, safety, and noise rules. A large majority of Utahns (82%) believe Utah families should be able to build Accessory Dwelling Units (ADUs) such as backyard cottages or garage apartments on their property while just 9% disagree. Additionally, 72% of Utahns think property owners should be able to divide their property into two lots to build a home on each if they choose, while just 13% disagree.
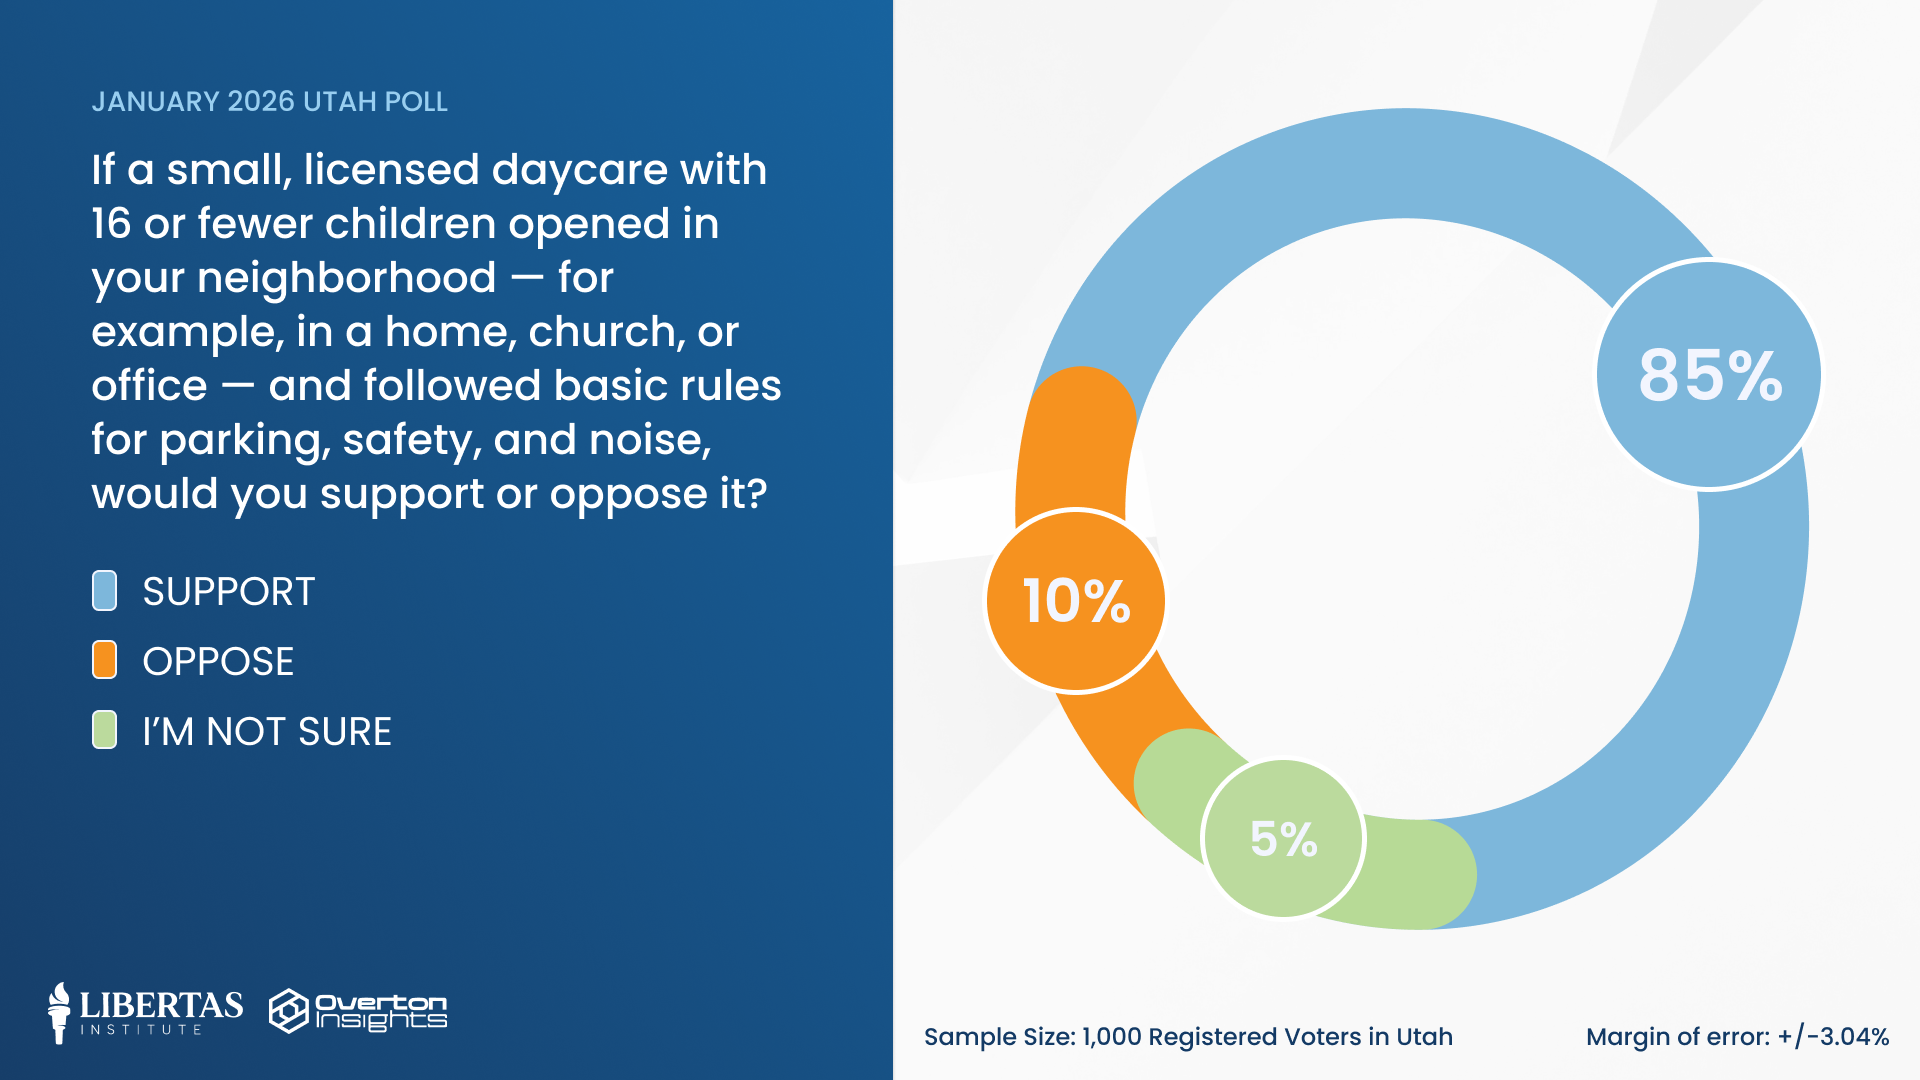
Utah’s favorable view of property rights extends beyond housing, with voters broadly supporting neighborhood-based services. A whopping 85% of Utah voters support a small licensed daycare with 16 children or fewer opening in their neighborhood, so long as basic rules are followed, while just 10% oppose it. Additionally, 69% of Utah voters support a small microschool of under 25 children opening in their neighborhood, so long as basic rules are followed, while 23% oppose it.
Utahns seek broader accountability measures when it comes to the government’s implementation and expansion of surveillance technology. An astonishing 84% of voters support requiring state and local government to hold public hearings before implementing new surveillance technologies such as facial recognition cameras or license plate readers. Public hearings are popular among Republicans (+72%), Democrats (+78%), and Independents (+67%). Additionally, 80% of voters believe the Utah legislature should review and approve new types of surveillance technology before state or local government agencies can use them, while just 12% oppose this form of legislative oversight.
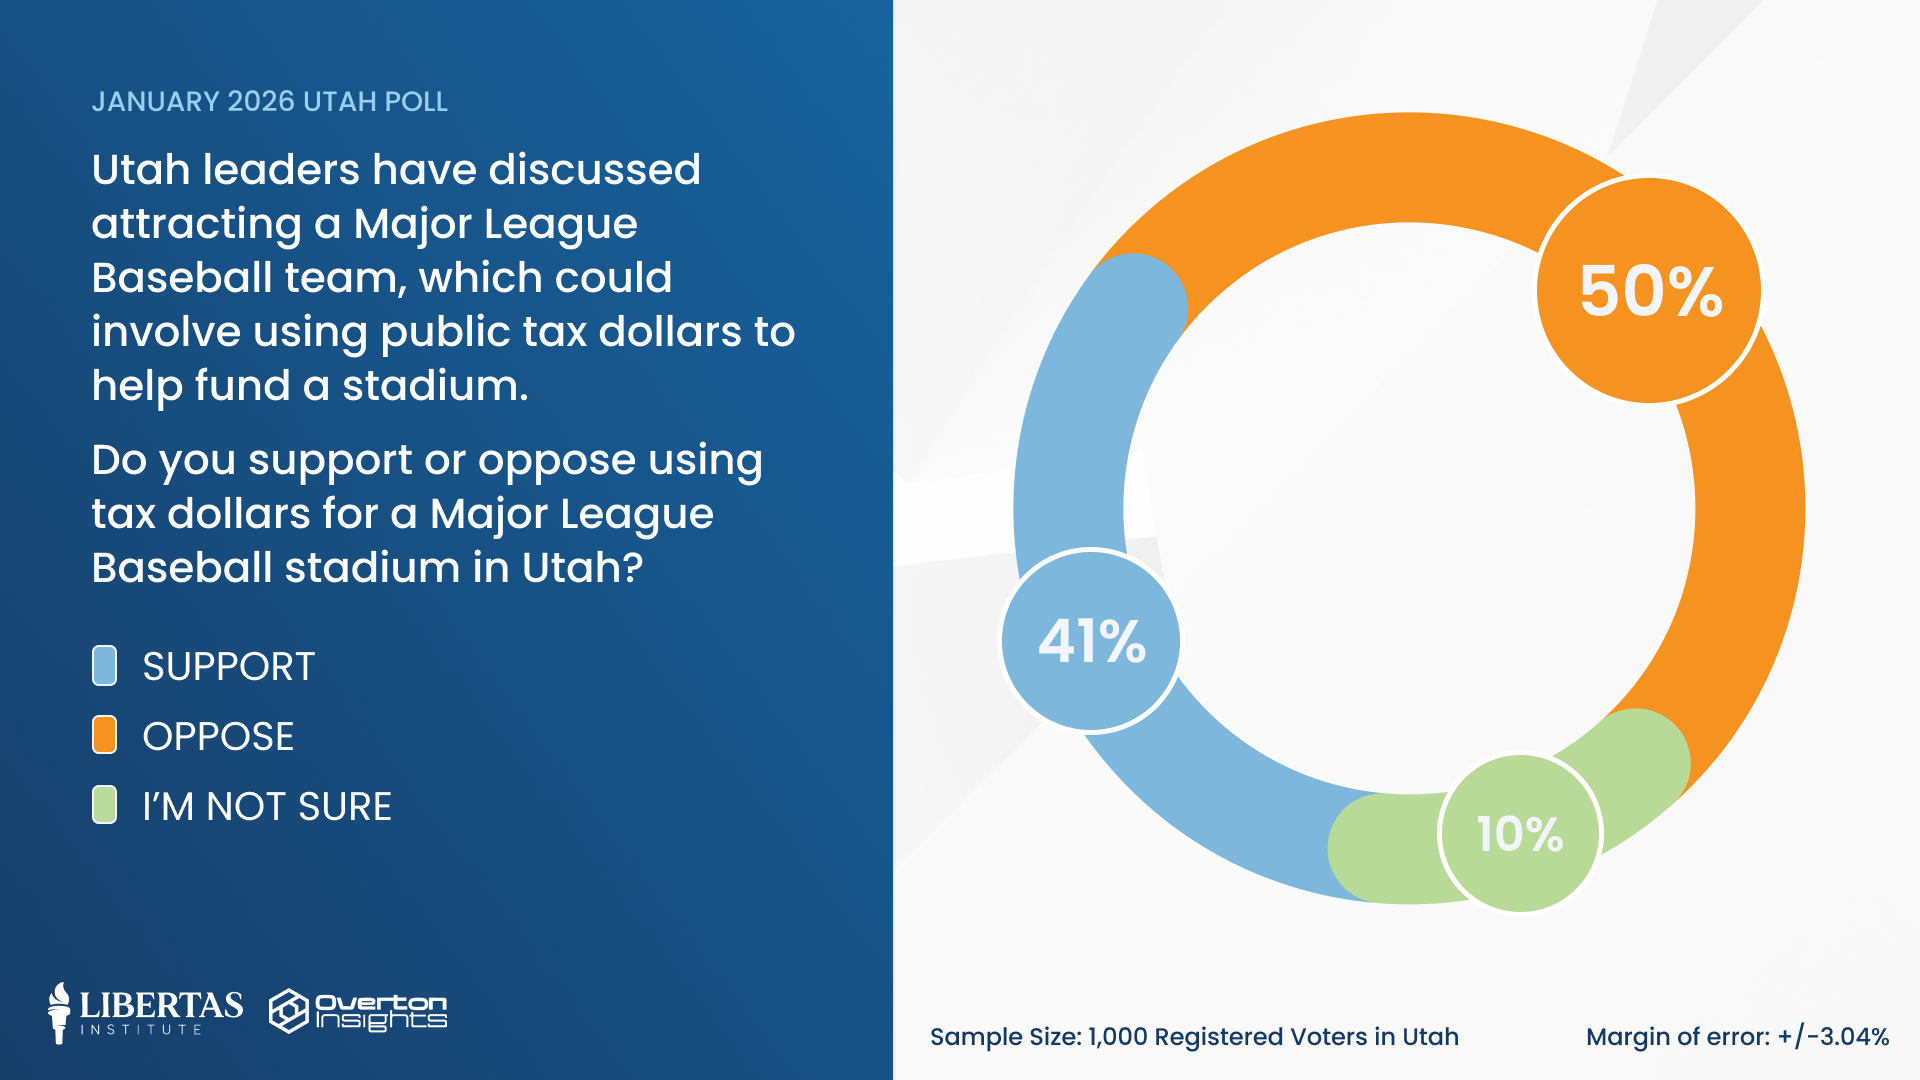
Salt Lake City was recently named a favorite to eventually land a Major League Baseball team by MLB insider Jeff Passan, but if that were to happen, Utah voters do not believe tax dollars should go to build a new stadium for the team. A slight majority of voters (50%) oppose using tax dollars for a Major League Baseball stadium in Utah while 41% would support using tax dollars to build the stadium. While Republicans (-3%) and Democrats (-2%) were barely against using tax dollars for a stadium, Independents (-21%) were the strongest opposition to a taxpayer-funded MLB stadium.
There are many other interesting results in the poll, ranging from voters’ top legislative priorities to their views on expanding nuclear energy facilities in Utah. You can view the full poll results here. Demographic crosstabs can be viewed here, and LDS crosstabs here.
Methodology
- Poll of 1,000 registered voters in Utah
- Only respondents who passed our data quality checks were included in the final results and compensated for participating.
- Respondents were recruited from two independent sources: 527 (53%) via online panel sample and 473 (47%) via SMS text message invitations (text-to-web) sent to cellphone numbers matched to records from registered voter files.
- Sampling was stratified by demographics and geography during allocation to target key subgroups within Utah.
- Results were weighted by demographics, party affiliation, geography, and behavioral measures to properly reflect the profile of the adult population in Utah
- Estimated margin of error: +/- 3.04%
- Due to weighting and rounding, percentages may not always total exactly 100%.